


How big is China’s manufacturing sector?
Almost certainly equal to the industrial nations formerly known as “advanced”
There was a bit of debate on Twitter a week ago about Ray Dalio’s comment that China was far ahead of the West in the volume of manufacturing production.

Elon Musk — using Grok, sigh — pointed out that the World Bank’s statistics didn’t match Dalio’s claim.

Ray Dalio does have different data!
The World Bank figures are in nominal terms. That means they will rise and fall with national currencies. If the dollar rises, then the nominal value of other countries’ production will fall, even if the amount of real stuff that they produce hasn’t changed. More importantly, the comparison doesn’t take into account the fact that manufactured goods don’t cost the same in all countries. Even in today’s hyperglobalized world, you can’t just take a pair of socks made in Fort Payne, Alabama, transport them to Datang, Zhejiang Province, and sell them for the same price. Transport costs, taxes and tariffs, export subsidies, distribution inefficiencies, branding, and market power can all drive a wedge between the price of the same manufactured goods in different countries.
Purchasing Power Parity (PPP) estimates try to take these differences into account when comparing economic output across countries. Instead of converting value using market exchange rates, the PPP methodology tries to find the exchange rate at which the cost of a basket of goods is equalized between two countries.
So we can just adjust the World Bank manufacturing numbers by the PPP exchange rate, right?
Well, no. The PPP rate is mostly made up of services, which form the bulk of economic output in most countries. (Yes, even China.) What we need is a rate that equalizes the cost of a basket of manufactured goods.
Fortunately, the OECD has calculated this. Unfortunately, they have not done it for China. So we can take the output of the bulk of the Western allies — maybe I should write “allies” after the events of the past week? — and add them up in a coherent fashion. But how do we then compare that output to China?
Well, for OECD countries roughly similar to China — say Mexico, Poland, or Turkey — their PPP exchange rate for manufactured goods runs roughly 35% to 50% higher than their overall PPP rate. That is to say, everything is cheaper in those countries than in the United States, but the gap for goods is significantly less than the gap for services. The reason is fairly intuitive. It may be costly to take structural steel and transport it from Istanbul to Brooklyn, but it is impossible to take a haircut in Başakşehir and sell it in Sunset Park. So the price of haircuts can vary a lot more than the price of structural steel.
The below chart adds together the manufacturing output of the United States, the U.K, the Eurozone, and Japan. (The data exist to add the rest of the E.U., if you want to do that.) It then overlays the range of output estimates for China in pink. The high estimate uses the overall PPP estimate to calculate Chinese output. There is no doubt that it is certainly too high.
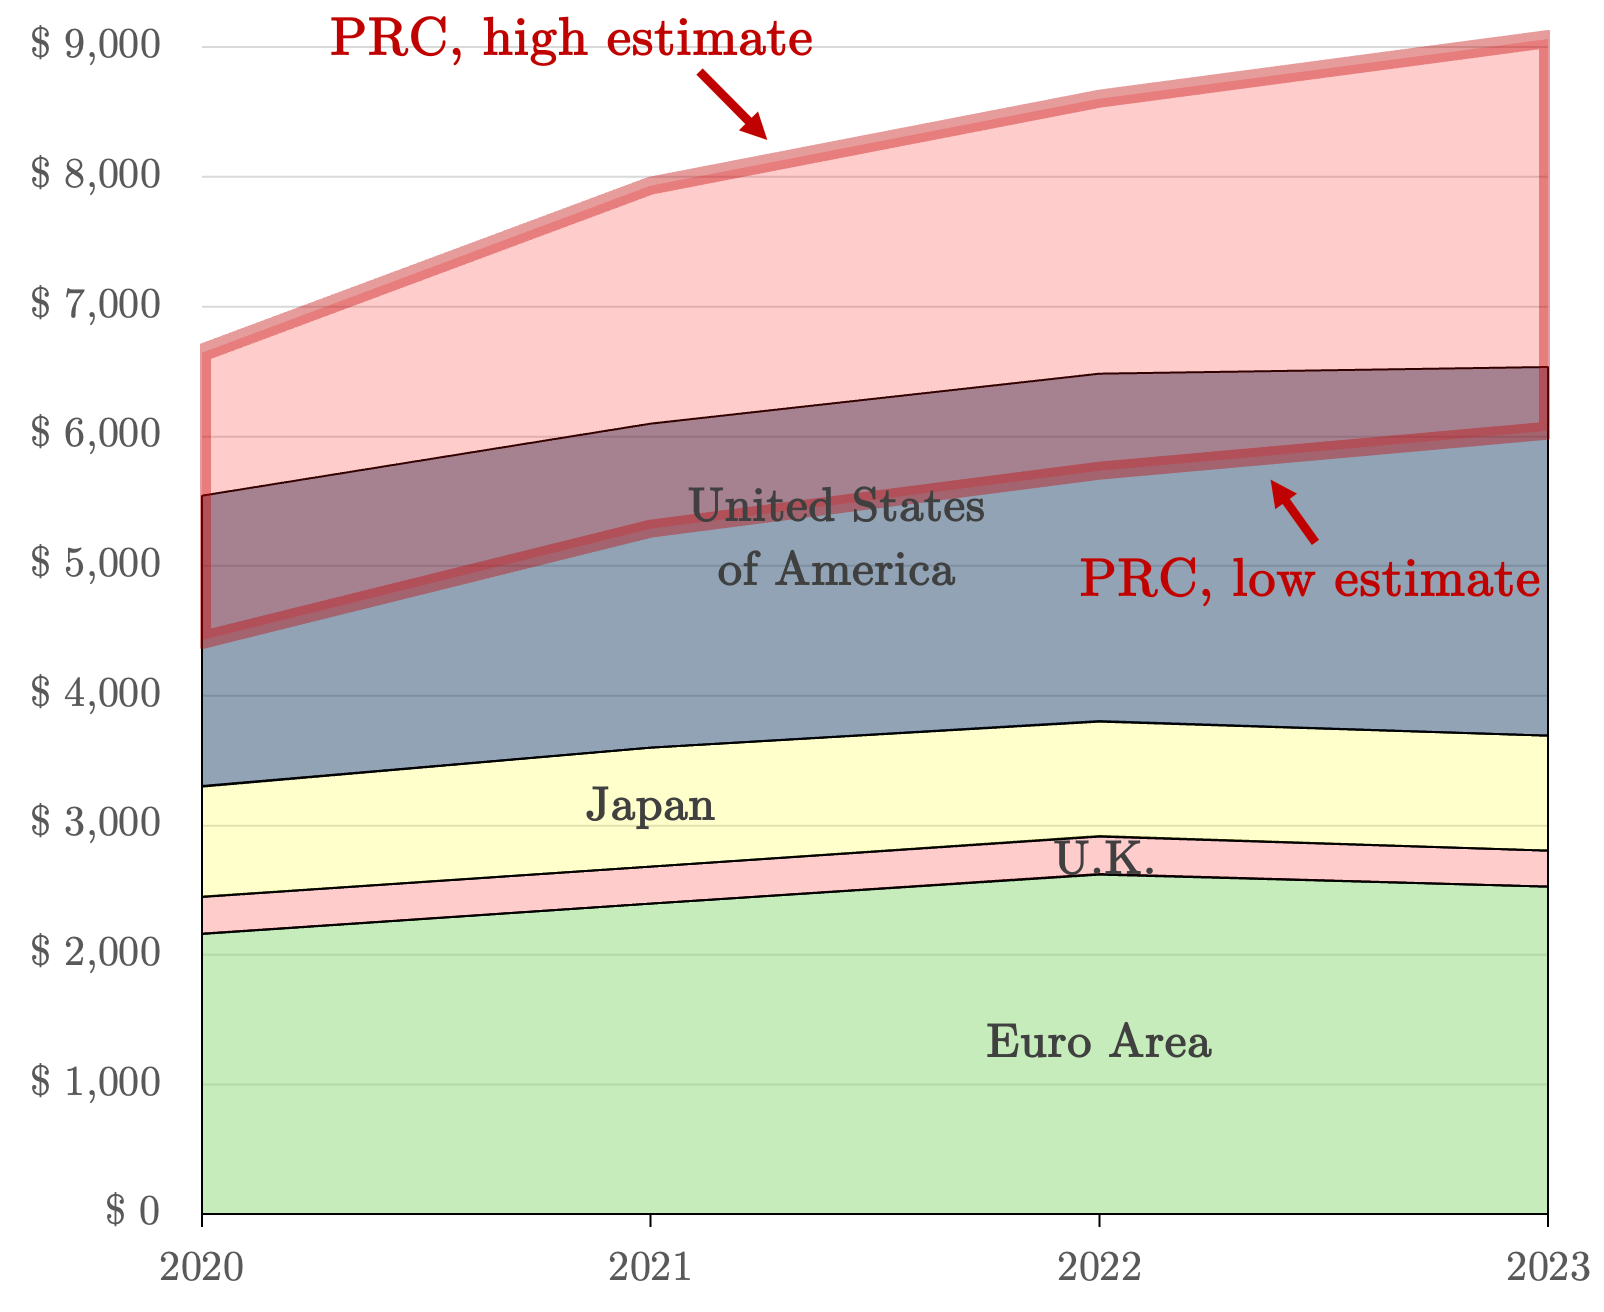
The lower estimate assumes that the gap between overall PPP and manufacturing PPP is the same in China as in Turkey, the country with the biggest gap. Judging from what people who have traveled to China tell me, it is almost certainly too low. For example, the price of a BYD Dolphin is €35,490 in the Netherlands … but only €12,947 in China. And it isn’t just fancy products like electric cars: hot rolled steel coils go for €650 per ton in Europe, against only €400 per ton in China.
But even if you take the low estimate of Chinese manufacturing output at PPP as gospel ($6.0 trillion), it is still roughly one-third higher than the $4.7 trillion nominal figure cited by Elon Musk. It’s also 93 percent of the combined production of the four jurisdictions in the chart. Considering that the low estimate is almost certainly too low, I think we should give this one to Dalio.
China’s share falls to 76% of Western industrial output if you add Mexico, Canada, South Korea, Poland and Australia — but even that figure is up ten points from 66% as recently as 2020. Now, it is reasonable to consider 2020 a bad benchmark (China’s zero-covid policies hit its manufacturing output very badly), but even then China’s relative share is rising by about two points every year.
In addition, keep in mind that not all manufacturing output is useful in wartime. China has a big advantage in a lot of those. Consider, for example, these figures from CSIS for worldwide cast metal production:
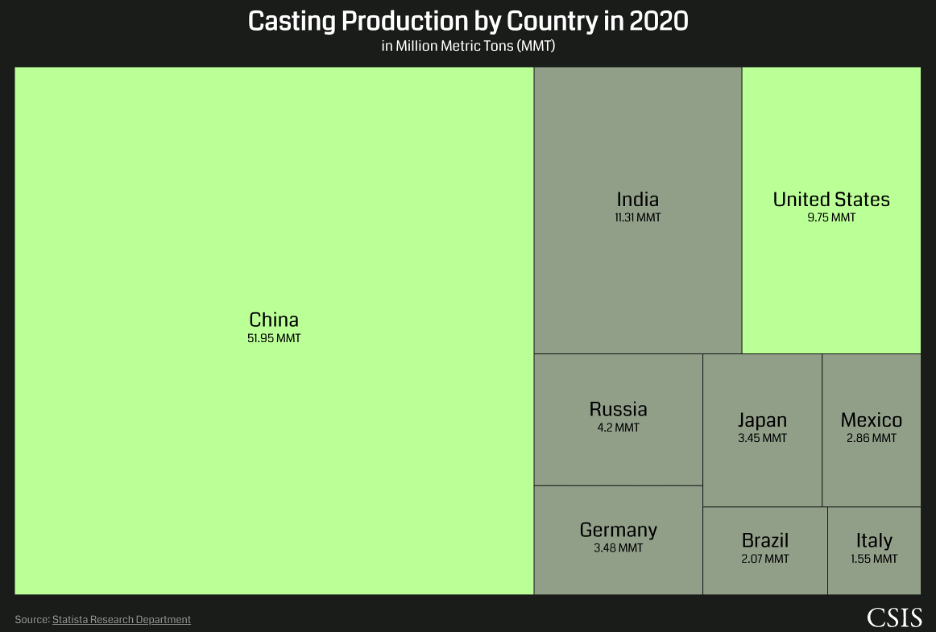
It’s great that the USA has operations like Brooklyn’s Barone Steel! (Go see the picture that opened this post.) But America’s total output is dwarfed by the PRC.
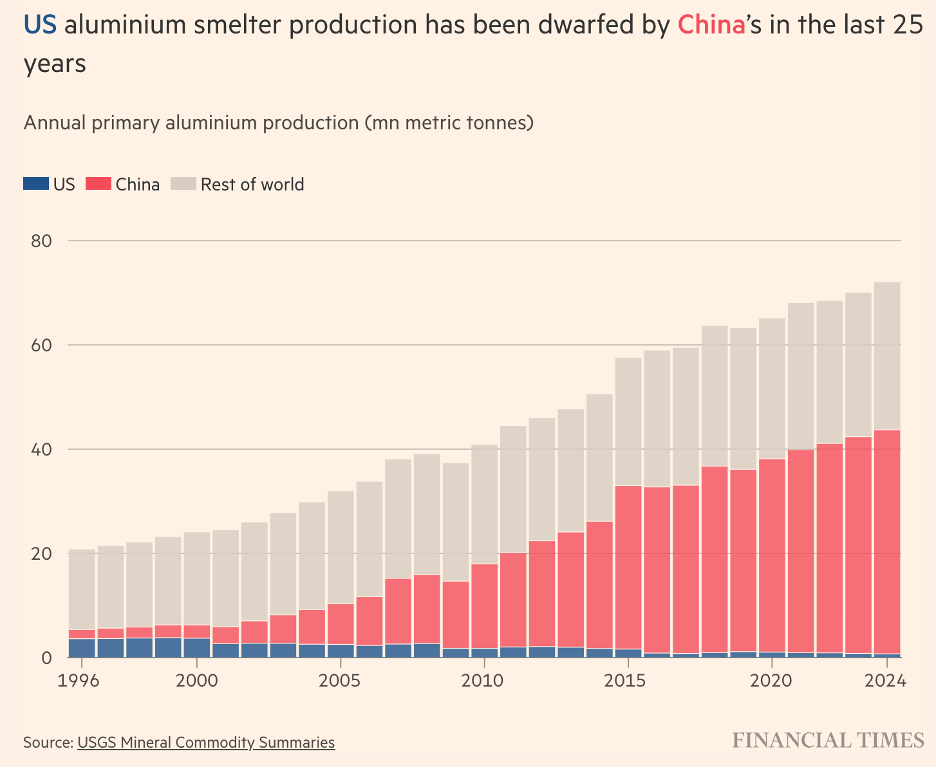
Or take these even scarier figures on aluminum production from the Financial Times:
We won’t talk about shipbuilding. My friend Martin Skold is all over that.
In short, it’s quite plausible that the PRC has equalled the manufacturing output of the “Western” democracies, and even if not, the low estimate is too close for comfort. Moreover, considering China’s industrial mix, the overall figure understates China’s industrial advantage in a prolonged conflict.
I’m not sleeping easy. I mean, China’s industrial dominance scares me less than the development of artificial intelligence, but it still scares me. Some sort of industrial policy is necessary. I don’t see how you can avoid high tariffs on Chinese goods as part of that.
I don’t see why you’d also impose tariffs on the E.U., let alone Canada and Mexico, but that’s a different story …